My First Two Months with OpenTelemetry: A Practical Guide

Table of Contents
“Why is this request so slow?” “Where did the error originate?” “What’s the actual path of a user request through our microservices?” If you’ve ever found yourself debugging a complex or distributed system, these questions are probably all too familiar. For the past two months, I’ve been diving deep into OpenTelemetry (OTEL), and it has fundamentally changed how I answer them.
This post isn’t just a theoretical overview; it’s a collection of my practical learnings and takeaways from instrumenting a real-world application. I’ll cover the why, what, and how of using OpenTelemetry, so you can avoid some of the hurdles I encountered.
Why Bother? The Payoff of Good Instrumentation#
Before we get into the technical details, let’s talk about the motivation. What do you actually get in return for the effort of instrumenting your application? The answer is clarity.
When your application is properly instrumented with traces, metrics, and logs, you can build powerful dashboards in tools like Grafana. This gives you a unified view of your system’s health and behavior.
- Deep Visibility with Traces: Understand what’s happening under the hood of your application. You can see which functions are called, how long they take, and where failures occur. A distributed trace can often make a complex stack trace much easier to follow.
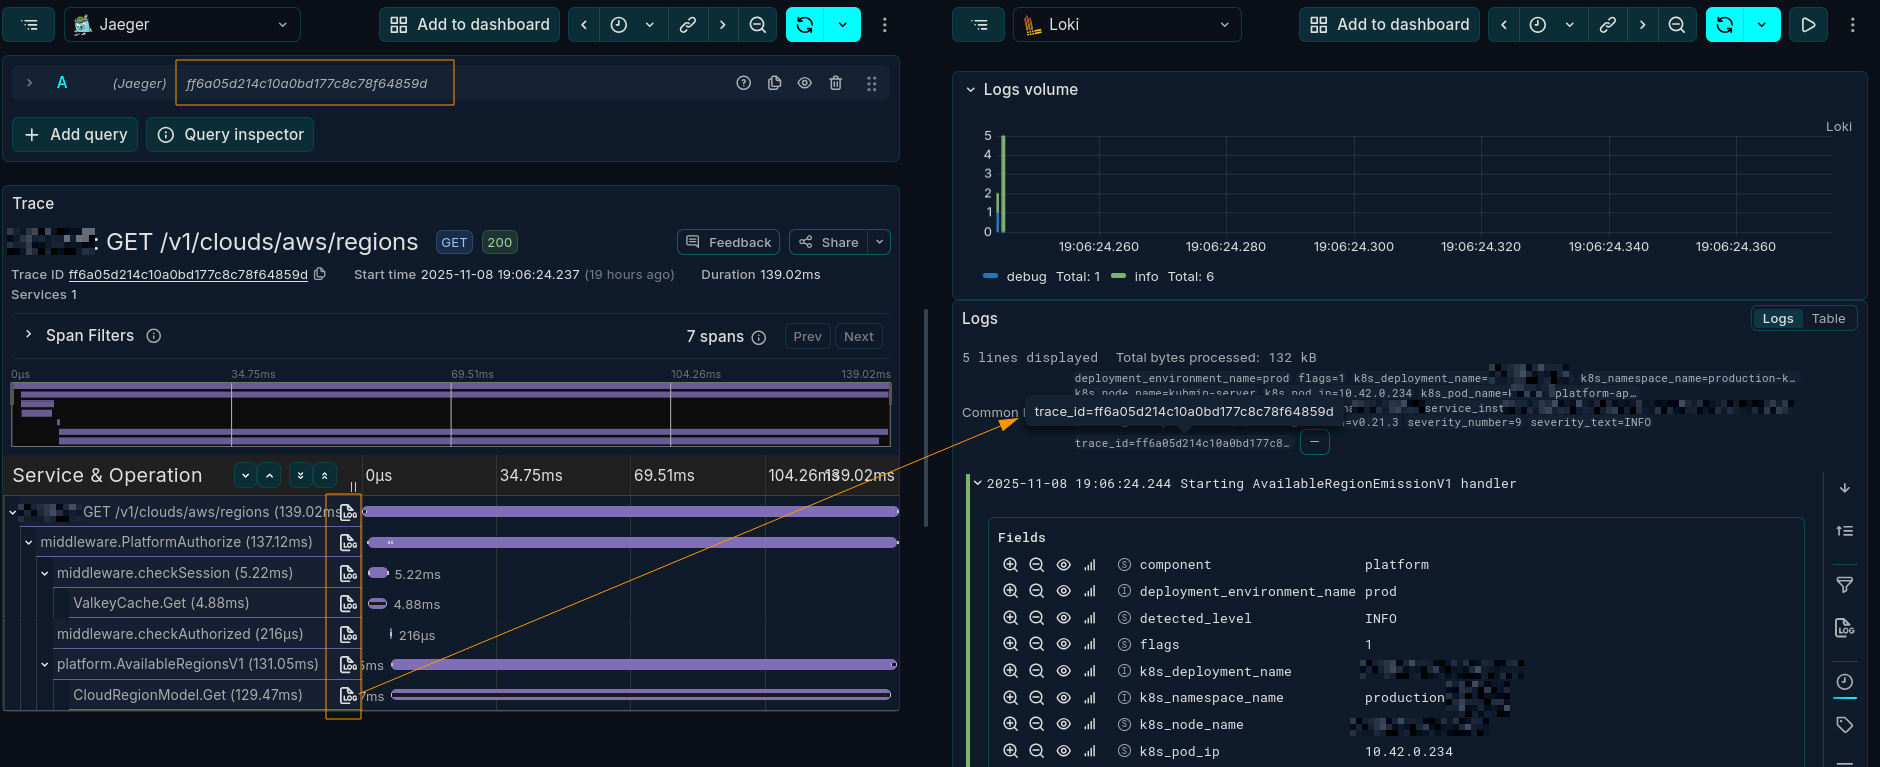
- Correlated Traces and Logs: One of the most powerful features is correlating traces with logs. With a single
trace_id, you can instantly find all the logs associated with a specific request, even as it hops across multiple services.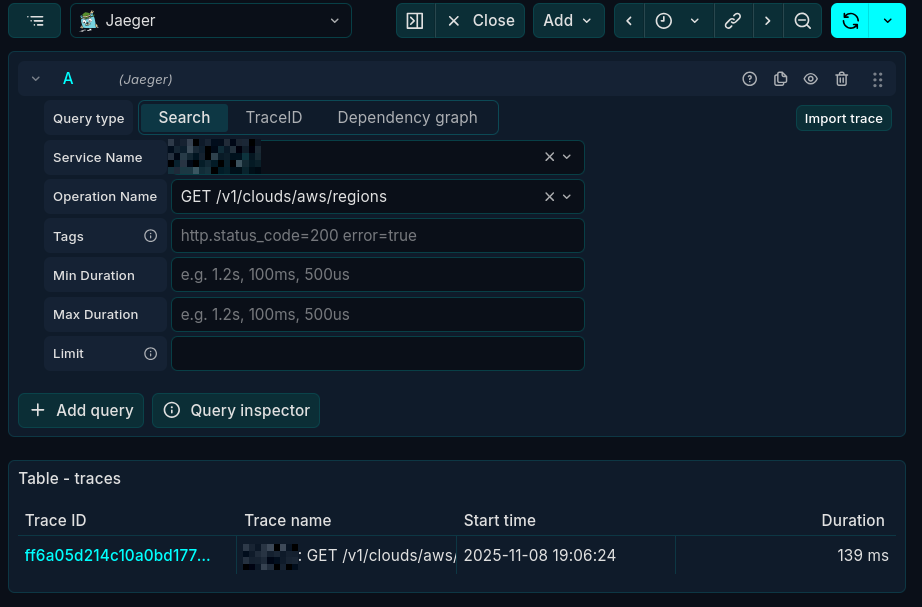
- Powerful Metrics: Monitor key indicators of your application’s health. Are requests per second dropping? Is the error rate for a specific service increasing? Are your background workers keeping up with the queue? Metrics help you answer these questions proactively.
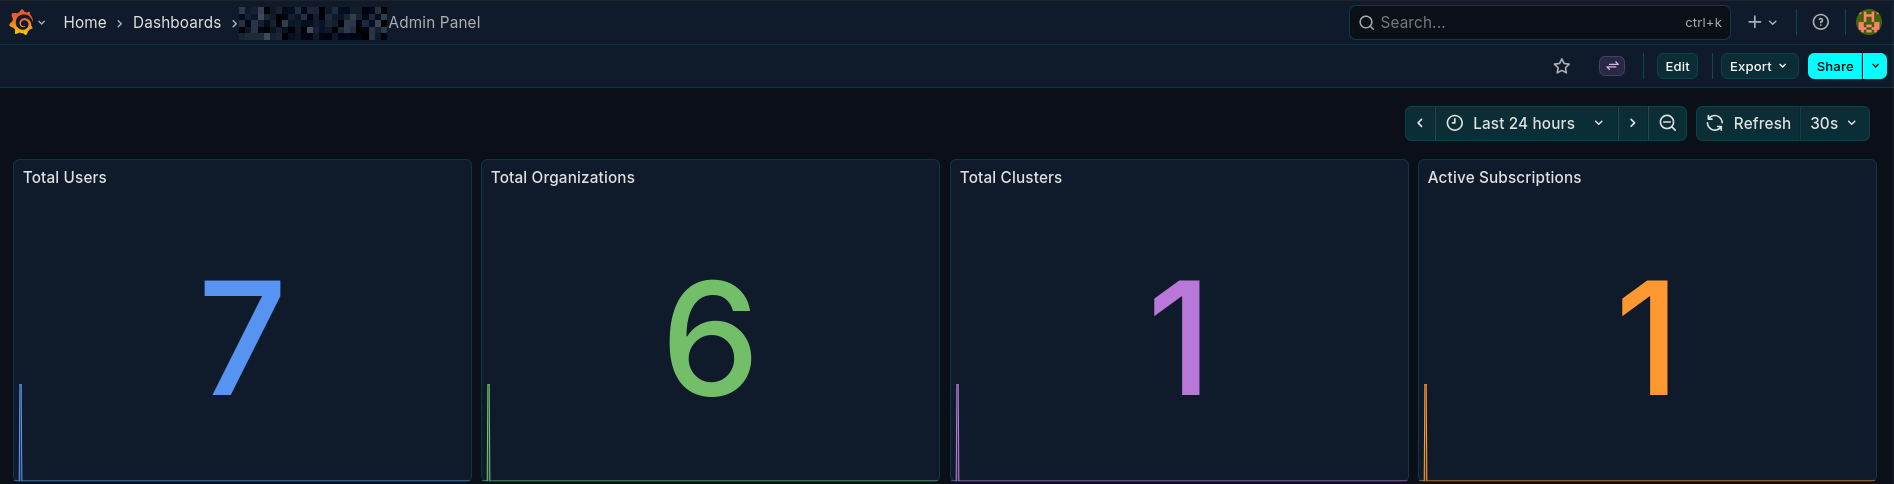
- Insightful Dashboards: You can create detailed admin panels and operational dashboards using only your OTEL data, providing instant insights without needing a separate frontend. Here’s an example of a dashboard showing application health:
The Core Concepts: What is OpenTelemetry?#
OpenTelemetry (OTEL) is an open-source observability framework that provides a standardized way to collect, process, and export telemetry data (traces, metrics, and logs).
It has two main parts:
- APIs and SDKs: Language-specific libraries (for Go, Python, Java, etc.) that you use to generate telemetry data from your application.
- The Collector: A central component that receives data from your instrumented applications. The collector can process this data (e.g., add attributes, filter, or batch) and export it to one or more backends like Jaeger, Prometheus, or Loki. Example configuration
receivers:
  # Receive traces and logs via OTLP (standard ports)
  otlp:
    protocols:
      grpc:
        endpoint: 0.0.0.0:4317
      http:
        endpoint: 0.0.0.0:4318

processors:
  # Batch for efficient processing
  batch:
    timeout: 5s
    send_batch_size: 512

  # Memory limiter to prevent OOM
  memory_limiter:
    check_interval: 1s
    limit_mib: 256
    spike_limit_mib: 64

exporters:
  # Export to stdout for local debugging
  debug:
    verbosity: detailed
    sampling_initial: 10
    sampling_thereafter: 50

  # Export traces to Jaeger
  otlp/jaeger:
    endpoint: jaeger:4317
    tls:
      insecure: true

  # Export logs to Loki via OTLP
  otlphttp/loki:
    endpoint: http://loki:3100/otlp
    tls:
      insecure: true

  # Export metrics to Prometheus via Remote Write
  prometheusremotewrite:
    endpoint: http://prometheus:9090/api/v1/write
    tls:
      insecure: true
    resource_to_telemetry_conversion:
      enabled: true

extensions:
  health_check:
  zpages:

service:
  extensions: [health_check, zpages]

  pipelines:
    traces:
      receivers: [otlp]
      processors: [memory_limiter, batch]
      exporters: [debug, otlp/jaeger]

    logs:
      receivers: [otlp]
      processors: [memory_limiter, batch]
      exporters: [debug, otlphttp/loki]

    metrics:
      receivers: [otlp]
      processors: [memory_limiter, batch]
      exporters: [debug, prometheusremotewrite]
Where the core pipelining happens under
service.pipelines.(traces|logs|metrics)
This architecture provides a unified layer for instrumentation. You only need to add the OTEL SDK to your application and point it to a collector. The collector then handles the complexity of sending data to your chosen storage backends.
What is a Span and When Should I Use It?#
Spans are the building blocks of a trace. A single span represents one unit of work, like an API call, a database query, or a function execution. It has a start time, an end time, and associated metadata like attributes and events.
Note: Spans are not free. Creating too many of them can add performance overhead and make traces noisy and difficult to read.
My rule of thumb: create spans for operations that have a meaningful duration or cross a system boundary. Good candidates for spans include:
- External API calls (e.g., to a third-party service).
- Database queries.
- Publishing or consuming messages from a queue.
- Significant, business-critical function calls.
In Go, this often means passing a context.Context variable through your function calls so you can create new spans that are correctly nested under their parent.
Good Spans vs. Bad Spans#
The goal is to create meaningful and manageable traces.
DO:
- Trace Boundaries: Create a root span for the initial inbound request to your service.
- Trace Network Calls: Wrap external HTTP requests, RPC calls, and database queries in spans.
- Use Generic Names: Name your spans with low-cardinality, generic names (e.g.,
HTTP GET /users/{id}). - Use Attributes for Details: Store dynamic or high-cardinality values like user IDs or request parameters as span attributes.
DON’T:
- Trace Trivial Functions: Avoid creating spans for simple getters, setters, or helper functions inside a tight loop. This adds noise, not clarity.
- Use Dynamic Span Names: A span name like
GET /users/123creates a new “class” of span for every user, which can overwhelm your observability backend.
When to Use Events Instead of Spans#
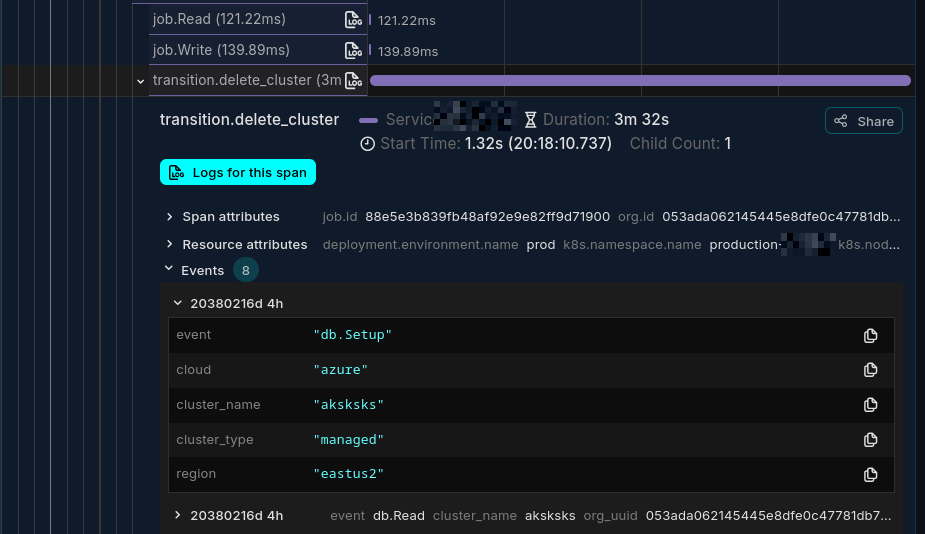
Sometimes, you want to mark a point-in-time occurrence within a span’s lifecycle without creating a whole new span. For this, use Span Events.
Events are perfect for logging important checkpoints. For example, instead of creating a new span for every write in a batch database operation, you could have a single db:batch_write span and add an event for each record being written.
The “How”: Instrumenting Your Application#
There are two primary ways to instrument an application.
- Manual Instrumentation: You add OTEL SDK calls directly into your code. This gives you maximum control but requires more upfront effort. If you own the codebase, this is often the best approach for creating clean, meaningful telemetry.
- Automatic Instrumentation: Some SDKs can automatically instrument popular libraries and frameworks without code changes. This is great for getting started quickly or for instrumenting third-party applications where you can’t modify the source. However, it can sometimes generate more data than you need.
Propagating Context Across Services#
In a microservices architecture, you need a way to connect the spans from different services into a single, end-to-end trace. This is handled by Context Propagation.
The TextMapPropagator is a tool that injects trace context (like the trace_id) into and extracts it from a carrier. For HTTP services, the carrier is usually the request headers. For message queues, it could be the message metadata.
Here is a conceptual example of how it works in a client-server interaction:
// Client Side: Injecting the context into HTTP headers
req, _ := http.NewRequest("GET", "http://example.com", nil)
// The propagator adds headers like "traceparent" to the request
propagator.Inject(ctx, propagation.HeaderCarrier(req.Header))
client.Do(req)

// Server Side: Extracting the context from headers
// The server reads headers from the incoming request
ctx := propagator.Extract(r.Context(), propagation.HeaderCarrier(r.Header))
// Now, any spans created will be part of the original trace
This mechanism is what allows you to see the full journey of a request across service boundaries.
Managing Data Volume with Sampling#
Instrumenting every single request can generate a massive amount of data and become expensive. Sampling is the solution. It allows you to control the volume of telemetry data you send to your backend.
There are two main strategies:
- Head-based Sampling: The decision to sample a trace is made at the very beginning (the “head”). For example, you might decide to keep only 10% of all traces. It’s simple and efficient but means you might discard traces that later turn out to be interesting (e.g., ones that contain an error).
- Tail-based Sampling: The decision is made after the trace has been completed (at the “tail”). This allows you to make more intelligent decisions, such as keeping all traces that contain an error or are longer than a certain duration. This is more powerful but requires a collector setup capable of buffering and analyzing traces.
For more details, check the Official Sampling Documentation.
Linking Spans for Complex Workflows#
What if you have a workflow where one event triggers multiple independent background jobs? The jobs aren’t children of the initial span in a traditional sense, but they are related. For this, you can use Span Links.
I used this for a background job processing system. A single “group job” event would be consumed by multiple workers concurrently. By linking the spans from each worker back to the original parent span, I could create a unified view of the entire distributed operation.

Conclusion: My Key Takeaways#
Instrumenting an application with OpenTelemetry is a journey, but the payoff in observability is immense. It’s more than just a tool; it’s a shift in how you think about and monitor your systems.
Here are my biggest takeaways from the last two months:
- Start with the “Why”: Understand what you want to observe before you write a single line of instrumentation.
- Spans are for Boundaries: Use spans for network, database, or significant business logic boundaries. Use events for everything else.
- Context is King: Master context propagation. It’s the key to unlocking true distributed tracing.
- Sample Intelligently: Don’t drown in data. Start with head-based sampling and explore tail-based sampling as your needs evolve.
Every application has different observability needs, so tailor your implementation accordingly. Start small, iterate, and continuously refine your strategy. The clarity you’ll gain into your application’s behavior is well worth the effort.
Obviously, this is just the tip of the iceberg when it comes to OpenTelemetry. There’s a whole ecosystem of tools and best practices to explore. But I hope this practical guide gives you a solid foundation to start your own observability journey.
Thank you for reading!